ELK_ElasticSearch-Logstash-Kibana搭建实时日志分析平台
http://my.oschina.net/itblog/blog/547250
http://baidu.blog.51cto.com/71938/1676798
1、ELK由ElasticSearch、Logstash和Kiabana三个开源工具组成。官方网站:https://www.elastic.co/products
• Elasticsearch是个开源分布式搜索引擎,它的特点有:分布式,零配置,自动发现,索引自动分片,索引副本机制,restful风格接口,多数据源,自动搜索负载等。
• Logstash是一个完全开源的工具,他可以对你的日志进行收集、过滤,并将其存储供以后使用(如,搜索)。
• Kibana 也是一个开源和免费的工具,它Kibana可以为 Logstash 和 ElasticSearch 提供的日志分析友好的 Web 界面,可以帮助您汇总、分析和搜索重要数据日志。

• 画了一个ELK工作的原理图: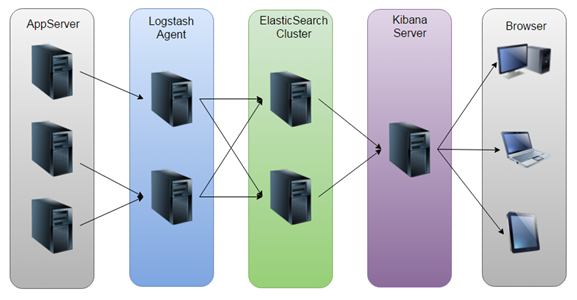
• 如图:Logstash收集AppServer产生的Log,并存放到ElasticSearch集群中,而Kibana则从ES集群中查询数据生成图表,再返回给Browser。
2、环境:
Linux:
Elasticsearch:elasticsearch-2.3.4.tar.gz
Logstash:logstash-2.3.4.tar.gz
Kibana:kibana-4.5.2-linux-x64.tar.gz
Jdk:jdk-8u91-linux-x64.tar.gz
3、jdk的安装:
mkdir -p /usr/local/java/
tar -zxvf jdk-8u91-linux-x64.tar.gz -C /usr/local/java/
vim /etc/profile
加入:
JAVA_HOME=/usr/local/java/jdk1.8.0_91
PATH=$JAVA_HOME/bin:$PATH
CLASSPATH=.:$JAVA_HOME/lib/dt.jar:$JAVA_HOME/lib/tools.jar
export JAVA_HOME
export PATH
export CLASSPATH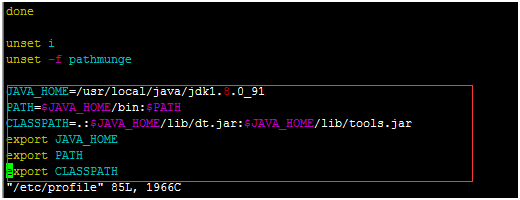
执行:
. /etc/profile #生效配置
java -version
4、安装配置Elasticsearch
4.1、安装配置Elasticsearch
tar -zxvf elasticsearch-2.3.4.tar.gz
cd elasticsearch-2.3.4
然后编辑ES的配置文件:
vim config/elasticsearch.yml
修改以下配置项:
cluster.name: wen
node.name: node-1
path.data: /path/to/data
path.logs: /path/to/logs
当前hostname或IP,这里使用ip
network.host: 10.10.20.210
http.port: 9200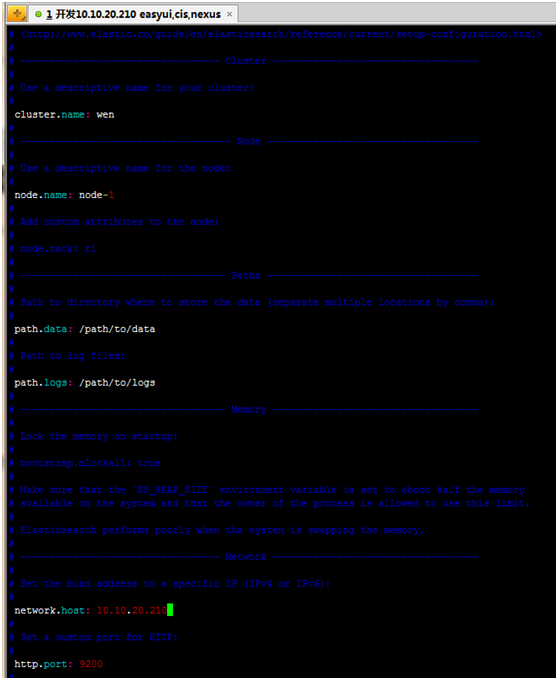
4.2、启动elasticsearch
./bin/elasticsearch
报错: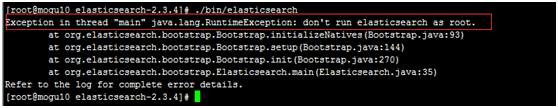
不能使用root用户启动elasticsearch
解决方法: http://my.oschina.net/topeagle/blog/591451?fromerr=mzOr2qzZ
将/data/soft/ch/elasticsearch-2.3.4/所属用户和组改为另外一个非root账户:
4.2.1、创建esgp组
groupadd esgp
4.2.2、创建用户es 添加到esgp组设置用户的密码为es123
useradd es -g esgp -p es123
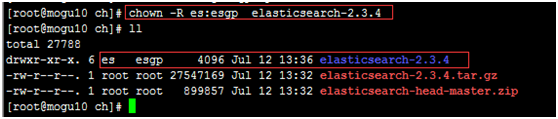
4.2.3、更改elasticsearch-2.3.4文件夹及内部文件的所属用户及组为es:esgp
chown -R es:esgp elasticsearch-2.3.4
4.2.4、切换到es用户
su es
4.2.5、启动elasticsearch
./elasticsearch-2.3.4/bin/elasticsearch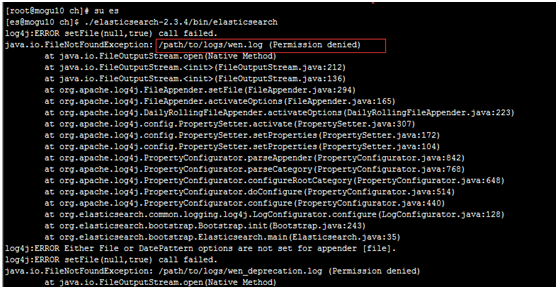
修改/path/to/logs/和/path/to/data/的权限:设置/path的用户为es,组为esgp
su root
chown -R es:esgp /path
再启动elasticsearch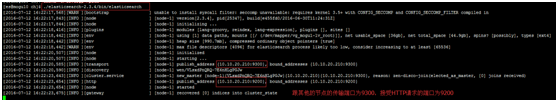
使用ctrl+C停止。当然,也可以使用后台进程的方式启动ES:
./elasticsearch-2.3.4/bin/elasticsearch –d
或者
./elasticsearch-2.3.4/bin/elasticsearch &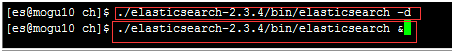
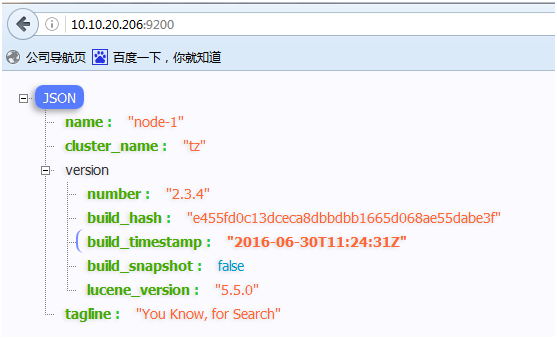
4.2.6、可以打开页面10.10.20.210:920,将会看到以下内容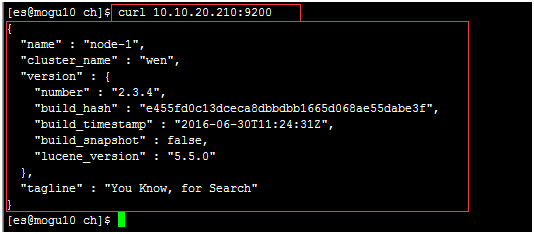
5、安装elasticsearch的插件:elasticsearch-head
https://github.com/mobz/elasticsearch-head
http://blog.csdn.net/july_2/article/details/24481935
5.1、插件安装方法1:
5.1.1.#./elasticsearch-2.3.4/bin/plugin -install mobz/elasticsearch-head
5.1.2.运行es
5.1.3.打开
http://10.10.20.210:9200/_plugin/head/
5.2、插件安装方法2:
5.2.1.https://github.com/mobz/elasticsearch-head下载zip 解压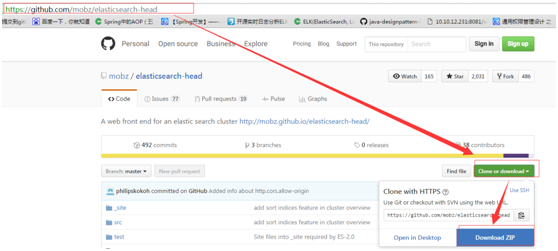
5.2.2.建立elasticsearch-2.3.4/plugins/head/_site文件
mkdir -p ./elasticsearch-2.3.4/plugins/head/_site
5.2.3.将解压后的elasticsearch-head-master文件夹下的文件copy到_site
1 | su root #切换到root用户 |

5.2.4.运行es
1
2
su es #切换到es用户
/data/soft/ch/elasticsearch-2.3.4/bin/elasticsearch
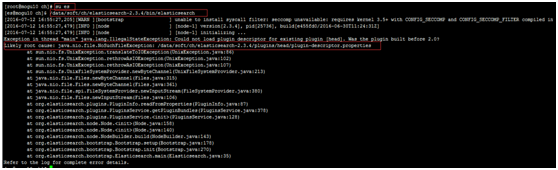
会报错,如上,拷贝plugin-descriptor.properties文件
1 | cp /data/soft/ch/elasticsearch-2.3.4/plugins/head/\_site/plugin-descriptor.properties /data/soft/ch/elasticsearch-2.3.4/plugins/head/ |
再启动elasticsearch
5.2.5.打开http://10.10.20.210:9200/`_plugin`/head/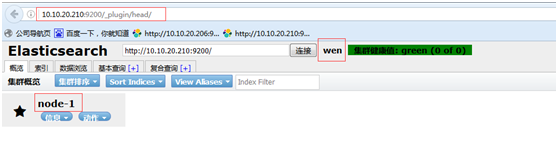
6、安装logstash-2.3.4.tar.gz
1 | tar -zxvf logstash-2.3.4.tar.gz |
1
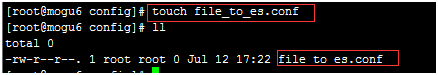
vim file_to_es.conf
输入内容:
1 | #For detail structure of this file |
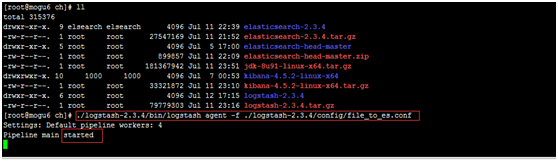
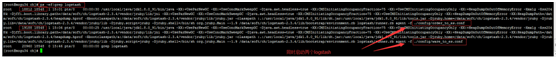
启动logstash
1 | ./logstash-2.3.4/bin/logstash agent -f ./logstash-2.3.4/config/file_to_es.conf |
后台启动(加上&):
1 | ./logstash-2.3.4/bin/logstash agent -f ./logstash-2.3.4/config/file_to_es.conf & |
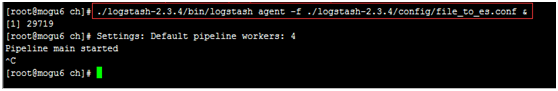
查看进程
可以在http://10.10.20.210:9200/`_plugin`/head/中看到自动创建了ware-manager-dev这个索引,里面保存的是ware-manager这个项目的日志
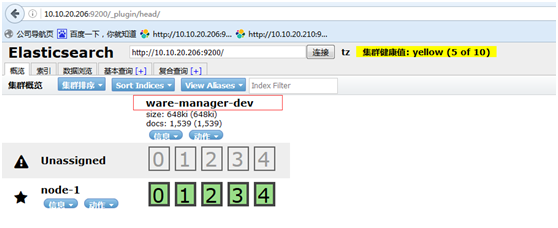
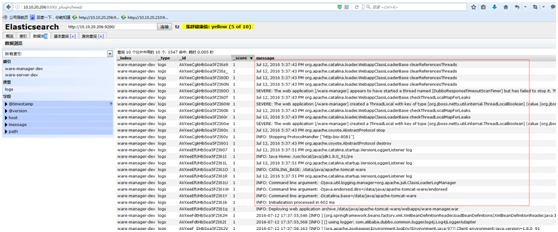
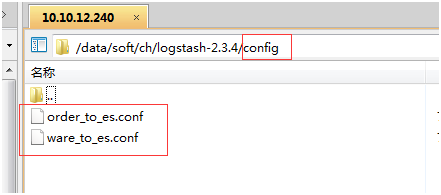
注意:如果在同一个服务器对不同的文件,设置不同的索引,那么可以增加配置文件然后制定配置文件启动即可
1
2
# ./logstash-2.3.4/bin/logstash agent -f ./logstash-2.3.4/config/order_to_es.conf &
#./logstash-2.3.4/bin/logstash agent -f ./logstash-2.3.4/config/ware_to_es.conf &
1 | order_to_es.conf的内容: |
7、安装kibana
1 | tar -zxvf kibana-4.5.2-linux-x64.tar.gz |
修改内容如下:
1 | server.port: 5601 |
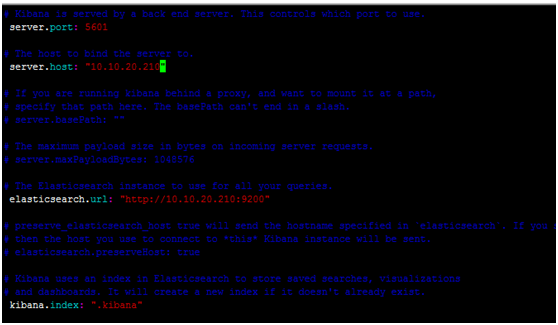
注意:其中server.host是安装kibana服务的地址
elasticsearch.url为elasticsearch安装的地址
启动kibana
1 | /data/soft/ch/kibana-4.5.2-linux-x64/bin/kibana |
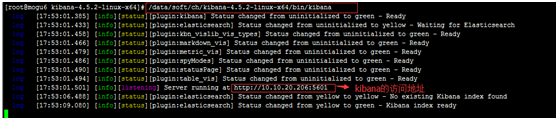
可以通过http://10.10.20.206:5601访问到。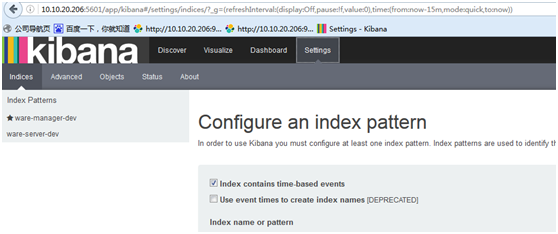
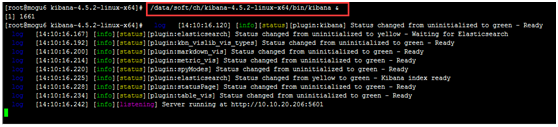
也可以后台启动kibana(加上&)
/data/soft/ch/kibana-4.5.2-linux-x64/bin/kibana &
注意:这时加上了&虽然执行了后台启动,但是还是有日志打印出来,使用ctrl+c可以退出。
但是如果直接关闭了Xshell,这时服务也会停止,访问http://10.10.20.206:5601就失败了。
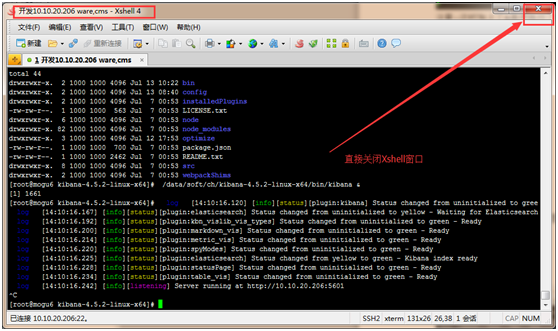
解决方法:
执行了/data/soft/ch/kibana-4.5.2-linux-x64/bin/kibana &命令后,不使用ctrl+c去退出日志,
而是使用exit;这样即使关闭了Xshell窗口服务也不会挂了。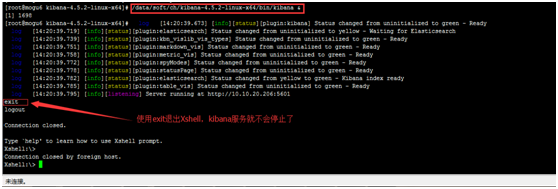
配置kibana: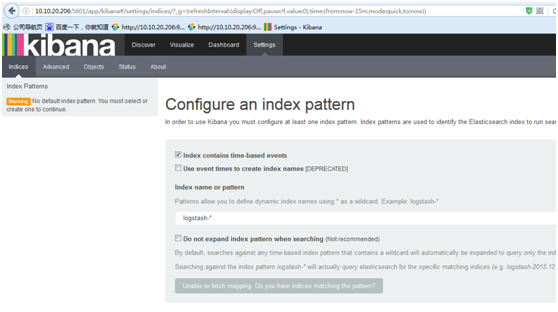
这时在elasticsearch中多了一个kibana的索引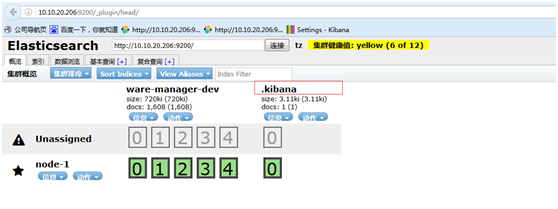
为了后续使用Kibana,需要配置至少一个Index名字或者Pattern,它用于在分析时确定ES中的Index。这里我输入之前配置的Index 名字ware-manager-dev,Kibana会自动加载该Index下doc的field,并自动选择合适的field用于图标中的时间字段: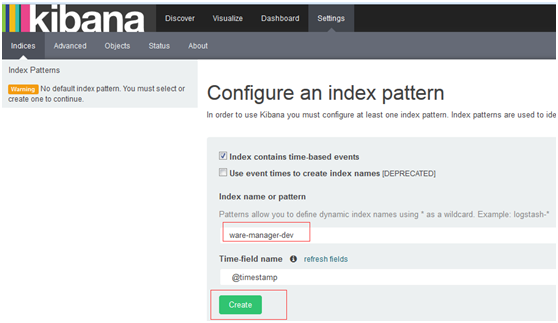
点击Discover查看日志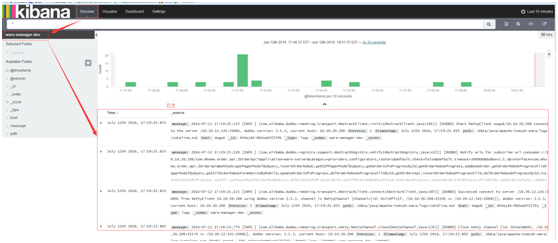
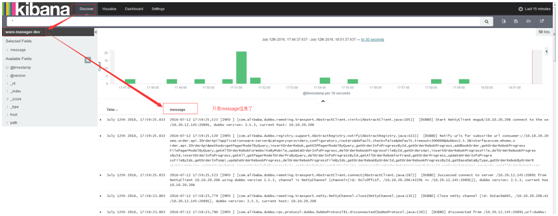
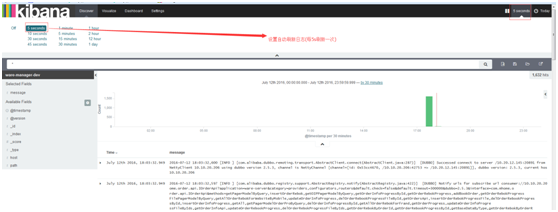
设置只查看message信息: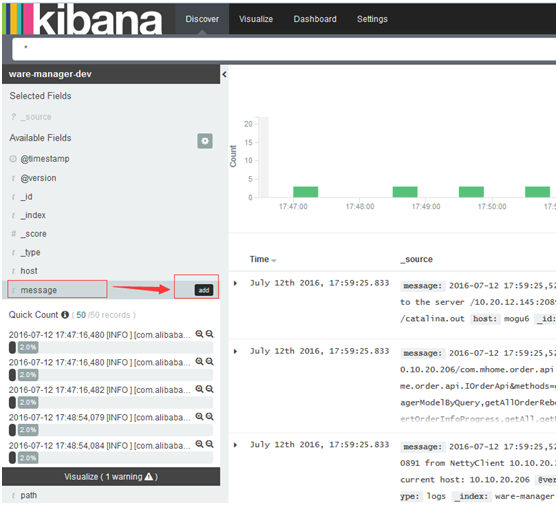
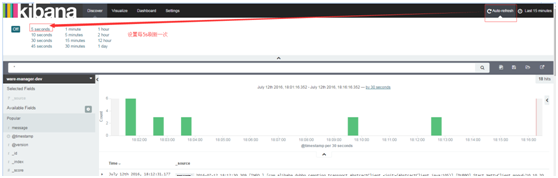
设置自动刷新: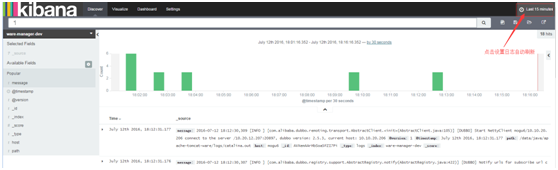
更多配置请查看:
http://my.oschina.net/itblog/blog/547250